Average U.S. Housing Price - Reasoning About Expectation
The Average
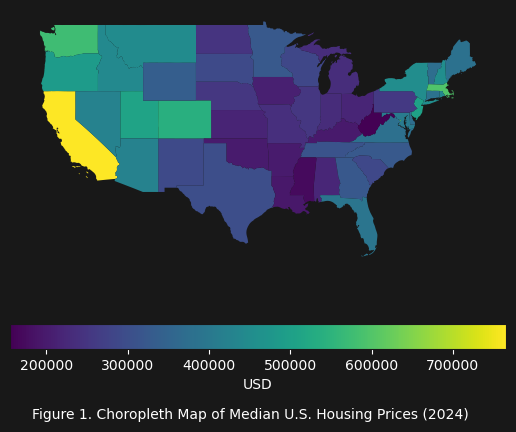
As of Q2 2024, the average U.S. home value according to Zillow is: $\textdollar354,179$. But what does this average really tell us? What insight about the U.S. housing market can we gain from this information? By itself, the average can really only give us a sense of the central tendency of the data: the vast majority of U.S. housing prices tend to cluster around this $\textdollar354,179$ price.
But what can it tell us about the probability that a house for sale in the U.S. market will have a given price (or fall within a certain price range)? Or that a given price deviates significantly from the average?
Normal Distribution
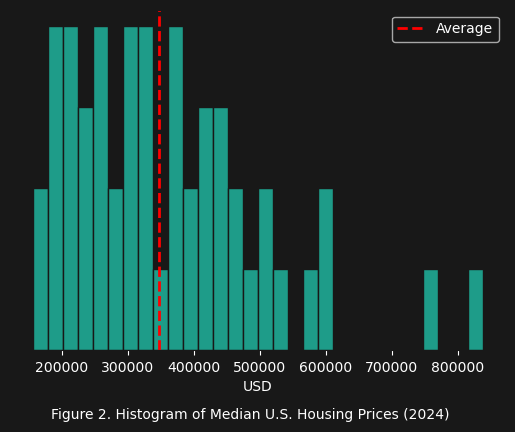
As seen in figures 1 and 2 above, which use median U.S. housing price data from Wikipedia, the average can really only give us a sense of the central tendency as mentioned before. To be able to answer questions related to probabibility we must create a normal distribution.
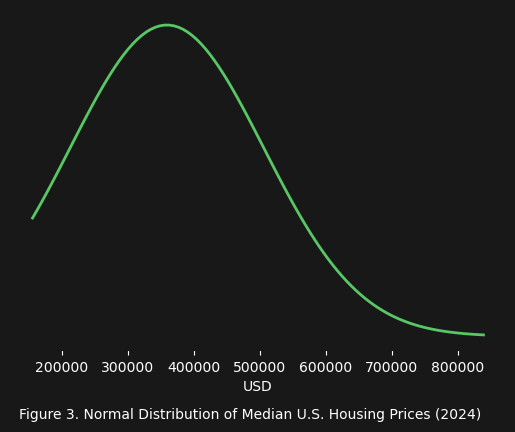
Figure 3 above shows the normal distribution of the 2024 median U.S. housing prices by state. It is generated by the following equation:
\[f(x) = \frac{1}{\sigma\sqrt{2\pi}} e^{-\frac{1}{2}\left(\frac{x-\mu}{\sigma}\right)^2}\]Since the distribution is generated from the median U.S. housing prices, the distribution is mising the lower end housing price values.
With this distribution, we can begin to estimate the probability of seeing a given range of prices. For example, what if we wanted to know the probability of seeing a house in the U.S. listed in the range $[\textdollar200,000 - \textdollar300,000]$? What we want to know is actually the area under the normal distribution.
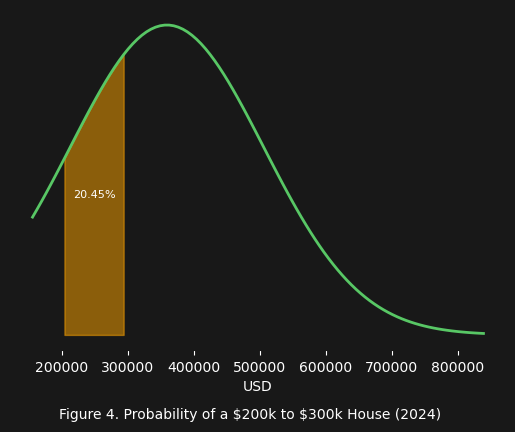
As figure 4 indicates, you have a $20.45\%$ or a $\sim\frac{1}{5}$ probability of encountering a house priced in the range $[\textdollar200,000 - \textdollar300,000]$ within the U.S.
Return of the Average
Now we are ready to actually begin to think about what the average means. As it turns out the average IS the value where, $50\%$ of the population is less than this value, and $50\%$ of the population is greater than this value.
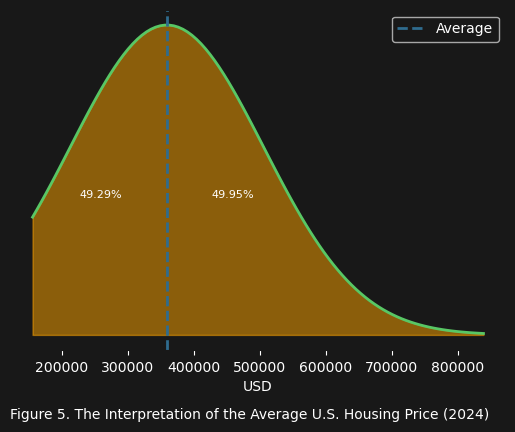
Basically, half the time when searching housing prices in the U.S. you will encounter a price below the average (i.e. about $\textdollar354,179$), and half the time the price will be above the average. This can be useful as a high-level view of a distribution, but it cannot tell us what price can truly be expected.
Expected Price
The truth about the expected price is simply that it only makes sense to consider a range of prices. For example, does any potential buyer care about finding a house priced at exactly $\textdollar300,000$? What about $\textdollar300,100$ or $\textdollar299,900$? So again we must turn to the normal distribution to satisfy our query: what is the range of prices we can expect in the U.S. housing market?
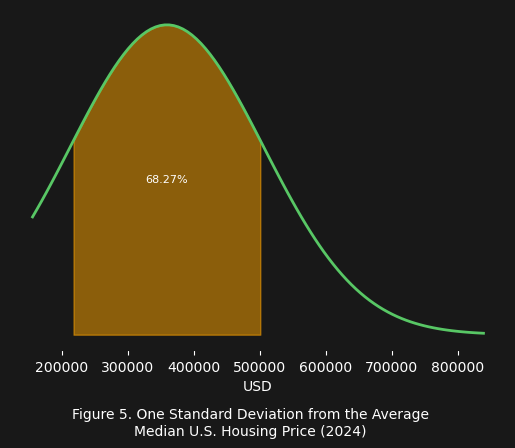
What figure 5 shows, is that we can expect to see $68\%$ or $\sim\frac{2}{3}$ of the houses listed in the U.S. housing market will have a price in the range $[\textdollar200,000 - \textdollar500,000]$. This is the lion’s share of the market, with the remaining $32\%$ or $\sim\frac{1}{3}$ of the market containing houses listed with price below $\textdollar200,000$ or above $\textdollar500,000$.
Moral
The average (i.e. $\textdollar354,179$) is not a good representation of the expected value that a potential buyer will encounter. Instead, a better representation of what to expect is the $68\%$ or $\sim\frac{2}{3}$ probability that a house listed in the U.S. housing market will have a price in the range $[\textdollar200,000 - \textdollar500,000]$. The average is best understood as a condensed estimate of where values cluster (i.e. around $\textdollar354,179$). It is a high-level view of the population, but without the standard deviation it cannot be used to reason about the values that will be obtained empirically.